

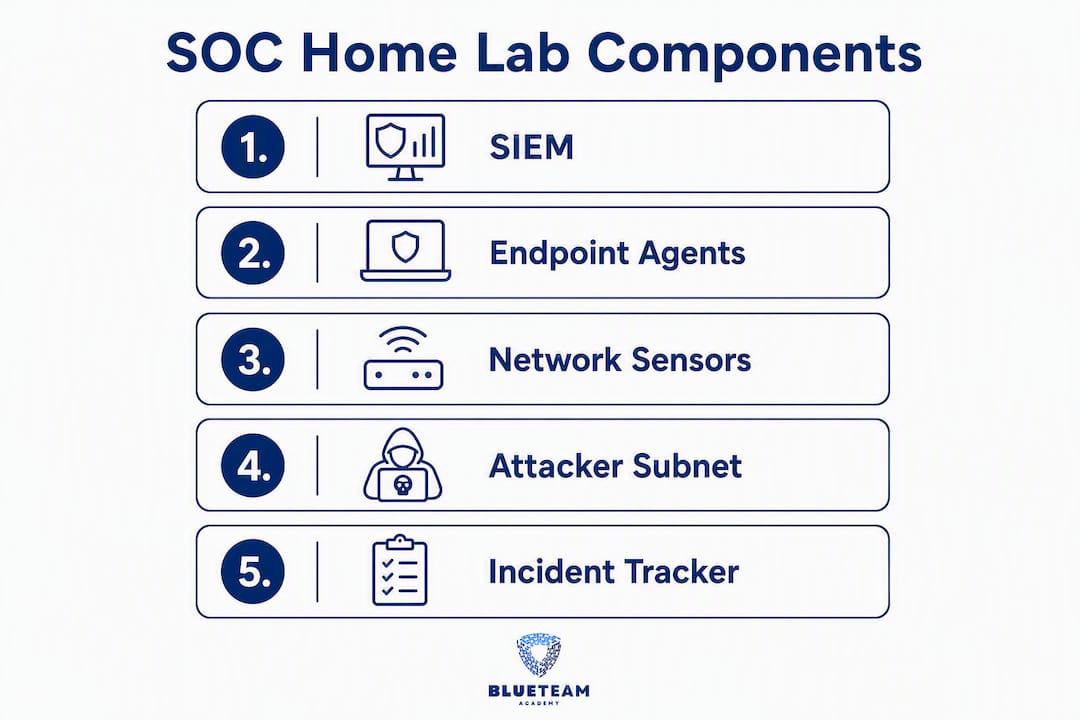
A working SOC home lab needs exactly five components to teach real security operations workflows: a SIEM, endpoint telemetry agents, a network sensor, an attacker host, and a case management system. Deploy these five together, and you have a pipeline that mirrors what analysts use in production. The minimal recommended stack is Wazuh (SIEM/XDR), Suricata (network IDS), Kali Linux (attacker host), pfSense (firewall and isolation), and osTicket or TheHive (case management). All of it is open-source and free.

Your first 30–90 minutes should go toward one goal: getting the SIEM VM online and enrolling a single endpoint agent. Everything else builds on that foundation.
Quick-start checklist:
- Deploy a Wazuh Manager VM (Ubuntu 22.04, 4 vCPUs, 8 GB RAM minimum)
- Enroll one Windows or Linux endpoint using the Wazuh agent installer
- Install Suricata on a sensor VM or directly on the pfSense host
- Spin up a Kali Linux VM on an isolated virtual network
- Install osTicket or TheHive for alert-to-ticket workflow practice
- Run your first Nmap scan from Kali and confirm the alert appears in the Wazuh dashboard
If you are on a Proxmox host, the lidless-labs/soc-stack project packages Wazuh, TheHive, MISP, Zeek, and Suricata into LXC containers and deploys the full stack quickly with a single command. That is the fastest path to a working lab.
Table of Contents
- What does a SOC home lab architecture actually look like?
- Which open-source tools should you run in each role?
- How do you choose and configure your virtualization host?
- Step-by-step network setup: VLANs, firewall, and sensor placement
- How do logs move from endpoints to your SIEM, and how do you write detections?
- What attack exercises should you run to validate your detections?
- How do you run a repeatable incident triage workflow in the lab?
- What does a SOC home lab actually cost, and how long does setup take?
- How do you document your lab build as a portfolio recruiters actually read?
- How structured training maps to lab exercises and career outcomes
- Key Takeaways
- Balancing realism and safety when running offensive tooling at home
- Blueteam-academy cuts your learning curve without replacing the lab
- Useful sources and repos to deploy the recommended stack
What does a SOC home lab architecture actually look like?
The architecture that makes a home lab both realistic and safe comes down to four logical zones, each with a distinct purpose. Think of it as building walls between your experiments so a misconfigured attacker VM never touches your home router.
The four zones:
- Management network (192.168.10.0/24): Your SIEM (Wazuh Manager), Elastic stack, TheHive/osTicket, and your admin workstation live here. This is the only zone with full visibility into everything else.
- Monitored VLAN / SOC subnet (192.168.20.0/24): Endpoint VMs with Wazuh agents installed. These are the “victims” your detections watch. Windows Server, Ubuntu Desktop, or any target OS goes here.
- Attacker / test subnet (192.168.30.0/24): Kali Linux and any adversary simulation VMs. This subnet has no direct route to the internet and no route to the management network unless you explicitly open one for a specific test.
- DMZ (192.168.40.0/24): Honeypots (Cowrie, DVWA) and any intentionally exposed services. Traffic hitting this zone generates high-fidelity alerts because nothing legitimate should be reaching it.
pfSense sits at the center, routing between zones and enforcing inter-VLAN rules. Your Suricata or Zeek sensor reads mirrored traffic from the monitored VLAN and the DMZ, feeding alerts into Wazuh. The management network sees everything; the attacker subnet sees almost nothing it did not ask for.
Pro Tip: Configure pfSense to block all outbound traffic from the attacker subnet by default. Create a dedicated NAT rule only when a specific test requires internet access, then remove it immediately after. This prevents a misconfigured Kali tool from accidentally scanning public infrastructure, which crosses legal and ethical lines fast.
Keeping an inventory dashboard, such as the one the Realynx/PolySIEM project demonstrates, helps you track which hosts are enrolled, which integrations are healthy, and what your current exposure surface looks like. A lab that is not documented is a lab you will rebuild from scratch every time something breaks.
Which open-source tools should you run in each role?

Open-source stacks built around Wazuh, Elastic, Suricata, Zeek, TheHive, and MISP now mirror what many mid-market production SOCs actually run. That fidelity is the point: you practice with tools you will encounter on the job, not toy simulators.
| Tool | Role | Learning Objective | Complexity / Resources |
|---|---|---|---|
| Wazuh | SIEM / XDR | Agent management, alerting, vulnerability detection | Low-Medium / 4 GB RAM |
| Elastic (ELK) | Log indexing / dashboards | KQL query language, log normalization | Medium / 4–8 GB RAM |
| Suricata | Network IDS/IPS | Signature writing, traffic analysis | Low / 1–2 GB RAM |
| Zeek | Network visibility / NSM | Protocol analysis, connection logs | Low-Medium / 1–2 GB RAM |
| TheHive + Cortex | Case management / SOAR | Triage workflows, automated enrichment | Medium / 4 GB RAM |
| osTicket | Lightweight ticketing | Alert-to-ticket pipeline, SLA practice | Low / 1 GB RAM |
| Cowrie | SSH/Telnet honeypot | Attacker behavior analysis, threat intel | Low / 8 GB RAM |
| DVWA | Vulnerable web app | Web exploitation detection, WAF tuning | Low / 8 GB RAM |
| Kali Linux | Attacker / red team host | Attack simulation, tool familiarity | Low / 2–4 GB RAM |
| MISP | Threat intelligence | IOC management, feed integration | Medium / 4 GB RAM |
| Sysmon | Windows endpoint telemetry | Event ID mapping, process telemetry | Low / minimal overhead |
A few notes on specific tools:
- Wazuh is the right SIEM choice for beginners. Community lab repos consistently use Wazuh Manager with Ubuntu-hosted dashboards and Windows agents because the setup is well-documented and the alerting is immediately useful.
- Elastic (ELK Stack) has both open-source and commercial tiers. For local lab use, the free tier covers everything you need: Elasticsearch, Logstash, Kibana, and Beats agents. Wazuh can ship logs directly to Elastic, giving you both platforms’ strengths.
- Sysmon from Microsoft Sysinternals is the single highest-value addition to any Windows endpoint in your lab. Install it with a community config (SwiftOnSecurity’s config is widely used) and your Windows telemetry immediately covers process creation, network connections, and file modifications mapped to MITRE ATT&CK.
- DVWA and Cowrie belong in the DMZ. They generate realistic attack traffic without requiring you to run real malware, which keeps the lab legal and safe.
How do you choose and configure your virtualization host?
Your hypervisor choice shapes everything: how many VMs you can run simultaneously, how fast you can snapshot and restore, and how much time you spend on infrastructure versus actual security practice.
Hardware tiers:
- Minimal (8 GB RAM / 4 cores): Run Wazuh Manager, one monitored endpoint, Suricata, and Kali. Skip Elastic for now and use Wazuh’s built-in dashboard. A documented 16-step home SOC project shows a working ELK stack plus attacker VMs on an 8 GB host using carefully sized VMs.
- Recommended (16–32 GB RAM / 6–8 cores): Add Elastic for dashboards, TheHive for case management, Cowrie and DVWA in the DMZ, and a second monitored endpoint. This tier lets you run the full pipeline without constant resource contention.
- Pro (64+ GB RAM / 8+ cores): Run a Proxmox cluster, add MISP for threat intel, experiment with containerized workloads, and keep multiple snapshots of different lab states.
Hypervisor options:
- Proxmox VE: The best choice for a dedicated lab machine. LXC containers for lightweight services (osTicket, Cowrie) and full VMs for Windows endpoints and Kali. The soc-stack project deploys the entire recommended stack on Proxmox in about 30 minutes.
- VMware ESXi (free tier): Solid performance and good snapshot management. The free license covers lab use, though some advanced features require a paid license.
- VirtualBox / VMware Workstation: Easiest starting point if you are running the lab on your daily-use machine. VirtualBox is free and cross-platform. Performance is lower than bare-metal hypervisors, but it works for a minimal stack.
Example VM sizing:
| VM | vCPUs | RAM | Storage |
|---|---|---|---|
| Wazuh Manager | 4 | 8 GB | — |
| Elastic (ELK) | 4 | 8 GB | — |
| Windows endpoint | 2 | 4 GB | — |
| Suricata sensor | 2 | 2 GB | 20 GB |
| Kali Linux | 2 | 4 GB | 40 GB |
| TheHive | 2 | 4 GB | 30 GB |
| Cowrie / DVWA | 1 | 1 GB | 10 GB |
Pro Tip: Use thin-provisioned disks and VM templates. Create a base Ubuntu 22.04 template with common packages pre-installed, then clone it for each new VM. Snapshots before major configuration changes save hours of rebuilding when something breaks.
Step-by-step network setup: VLANs, firewall, and sensor placement
Getting the network right before you install any security tools prevents a lot of pain later. Follow this sequence:
- Create VLANs in your switch or hypervisor. Assign VLAN IDs: 10 (management), 20 (monitored), 30 (attacker), 40 (DMZ). In Proxmox, create Linux bridges for each VLAN and assign VMs to the appropriate bridge.
- Install pfSense on a VM with four virtual NICs, one per VLAN. Assign each interface an IP from the corresponding subnet (e.g., 192.168.10.1 for management, 192.168.20.1 for monitored).
- Configure inter-VLAN firewall rules. Allow management (VLAN 10) to reach all other VLANs. Block VLAN 30 (attacker) from reaching VLAN 10 (management) and from reaching the internet by default. Allow VLAN 20 to send logs to VLAN 10 on port 1514 (Wazuh) and 9200 (Elastic).
- Set up NAT on pfSense for VLANs that need controlled internet access (management and monitored). The attacker VLAN gets no NAT rule by default.
- Configure a port mirror or SPAN. In Proxmox, use a Linux bridge with promiscuous mode enabled for the Suricata sensor VM. In a physical setup, configure your managed switch to mirror the monitored VLAN to the sensor port.
- Deploy Suricata on the sensor VM and point it at the mirrored interface. Configure Suricata to output EVE JSON logs to
/var/log/suricata/eve.json. - Forward Suricata logs to Wazuh. Install the Wazuh agent on the sensor VM and configure
/var/ossec/etc/ossec.confto read the EVE JSON file. Wazuh parses Suricata alerts natively and maps them to its ruleset.
| Zone | VLAN | Subnet | Outbound Internet | Reaches Management |
|---|---|---|---|---|
| Management | 10 | 192.168.10.0/24 | Yes (NAT) | N/A |
| Monitored | 20 | 192.168.20.0/24 | Yes (NAT) | Log ports only |
| Attacker | 30 | 192.168.30.0/24 | Blocked by default | Blocked |
| DMZ | 40 | 192.168.40.0/24 | No | Log ports only |
How do logs move from endpoints to your SIEM, and how do you write detections?
The data flow in a real SOC follows a predictable path: endpoint agent collects events, ships them to a collector, the indexer stores and normalizes them, the rule engine fires on matching patterns, an alert is generated, and a webhook creates a ticket in your case management system. Replicating that full pipeline is what separates a useful lab from a collection of installed tools.
The pipeline, step by step:
- Endpoint agent (Wazuh agent / Sysmon / osquery): Collects process creation, network connections, authentication events, and file changes. On Windows, Sysmon feeds into the Wazuh agent via the Windows Event Log channel.
- Log forwarder: Wazuh agent ships events to Wazuh Manager on port 1514 (UDP/TCP). Filebeat ships Suricata EVE JSON to Elasticsearch on port 5044.
- Indexer / collector: Elasticsearch stores and indexes all events. Wazuh Manager applies its ruleset in real time.
- Rule engine: Wazuh rules fire when event patterns match. Elastic detection rules (written in EQL or KQL) run on a schedule against the indexed data.
- Alert → webhook → ticket: Configure a Wazuh integration or Kibana alert action to POST to osTicket’s API or TheHive’s API when a rule fires above a set severity threshold.
Example detection rule (SSH brute force):
Wazuh ships with rule ID 5712 for SSH authentication failures. When more than eight failures occur from the same source IP within 120 seconds, the rule fires at level 10. The key fields are srcip, dstuser, and the authentication_failed decoder group. You can tune the threshold and add an active response to block the source IP via pfSense’s firewall API.
Pro Tip: Map every detection you author to a MITRE ATT&CK technique ID. Wazuh supports ATT&CK tagging natively. After two weeks of exercises, run a coverage report to see which tactics you can detect and which are blind spots. That gap list becomes your next sprint’s work.
What to build in your dashboards first:
- Login failures by source IP and destination host (covers T1110 Brute Force)
- Process creation with unusual parent-child relationships (covers T1059 Command and Scripting Interpreter)
- Outbound connections to new or rare destinations (covers T1071 Application Layer Protocol)
- Honeypot interaction events from Cowrie (any connection is suspicious by definition)
What attack exercises should you run to validate your detections?
Practical lab guides consistently show that collection, detection, and triage practiced together produce more durable skills than any single tool mastered in isolation. These exercises are graduated: start with recon and work toward simulated C2.
Exercise 1: Recon and scanning
Run nmap -sV -O 192.168.20.0/24 from your Kali VM. Expected telemetry: Suricata ET SCAN rules fire, Wazuh generates network scan alerts, and Zeek logs show connection attempts across multiple ports. Goal: confirm your sensor sees the scan and author a Wazuh rule that creates a high-severity alert for port scans originating from VLAN 30.
Exercise 2: SSH brute force
Use Hydra from Kali against an SSH service on a monitored endpoint: hydra -l root -P /usr/share/wordlists/rockyou.txt ssh://192.168.20.10. Expected telemetry: Wazuh rule 5712 fires repeatedly, Suricata ET BRUTE rules trigger, and authentication failure events stack up in Kibana. Goal: tune the threshold, create a ticket in osTicket via webhook, and document the investigation.
Exercise 3: Web app exploitation (DVWA)
Set DVWA’s security level to “low” and run a SQL injection or XSS attack from Kali using Burp Suite or manual payloads. Expected telemetry: Suricata web attack signatures fire, Wazuh web log rules detect anomalous HTTP status codes. Goal: author a detection for SQL injection attempts and map it to MITRE T1190 (Exploit Public-Facing Application).
Exercise 4: Honeypot interaction (Cowrie)
Any connection to Cowrie from the attacker subnet is an alert. SSH into Cowrie from Kali and run a few commands. Expected telemetry: Cowrie logs the session in JSON, Wazuh ingests it, and you see the attacker’s commands replayed in the dashboard. Goal: write an investigation note documenting what the “attacker” did and what data they accessed.
Exercise 5: Simulated C2 beaconing
Use a simple Python script on Kali that sends periodic HTTP GET requests to a controlled server on the management network. Expected telemetry: Zeek connection logs show regular interval beaconing, Elastic detects the pattern with a threshold rule. Goal: author a detection for beaconing behavior using connection frequency and destination consistency.
Short triage playbook (copy into TheHive or osTicket):
- Acknowledge the alert and assign it to yourself.
- Identify the source IP, destination, and protocol from the alert fields.
- Query the SIEM for all events from the source IP in the last 24 hours.
- Determine whether the source is a lab asset (expected) or an anomaly.
- Classify the incident: true positive, false positive, or needs escalation.
- Document findings, close the ticket, and update the detection rule if needed.
How do you run a repeatable incident triage workflow in the lab?
A repeatable triage workflow is what turns a collection of alerts into actual incident handling practice. The goal is muscle memory: you should be able to move from alert to closed ticket in under 30 minutes for a straightforward event.
Triage checklist:
- Evidence collection: Screenshot the alert, export relevant log lines, and note timestamps in UTC.
- Scope: How many hosts are involved? Is the activity contained to one VLAN or has it crossed zone boundaries?
- Impact: What data or services could be affected? In the lab, this is simulated, but practice articulating it as if it were real.
- Containment: In the lab, this means blocking the source IP in pfSense or isolating the affected VM’s network interface.
- Short-term remediation: Reset credentials, patch the vulnerable service, or update the detection rule to catch the variant.
- Documentation: Fill in the incident report template and grade the investigation.
Incident report template fields:
| Field | Description |
|---|---|
| Incident ID | Auto-generated by TheHive or osTicket |
| Detection source | Which rule or sensor fired |
| Affected assets | Hostnames and IPs involved |
| Timeline | First seen, escalated, contained, closed |
| MITRE technique | ATT&CK ID and tactic |
| Root cause | What allowed the activity to succeed |
| Remediation | Steps taken and verification |
| Lessons learned | What detection or control to improve |
A single full exercise, from alert acknowledgment to closed ticket with a written report, takes a moderate amount of time for a beginner. Running one exercise per week builds a portfolio of investigation write-ups that hiring managers can read as evidence of real analytical work. Repos that implement the full alert-to-ticket pipeline show Kibana webhook integrations with osTicket that automate ticket creation the moment a high-severity alert fires, which cuts the manual steps and lets you focus on the investigation itself.
What does a SOC home lab actually cost, and how long does setup take?
Most of the software in this stack is free. The real cost is hardware, and you can start with what you already have.
Choose from entry, mid-level, or advanced hardware tiers offering increasing capacity and capabilities, with setup and detection readiness times varying accordingly.
Where most time actually goes:
- Log forwarding and normalization (getting Suricata, Sysmon, and endpoint agents all talking to the same indexer) takes longer than any single tool installation.
- Detection tuning: your first rules will fire on everything. Expect to spend as much time reducing false positives as writing new rules.
- Integration between TheHive/osTicket and Wazuh webhooks requires reading API docs and testing payloads, but it is the most valuable skill you will practice.
Cost-saving options:
- Repurpose an old workstation or a decommissioned office PC. A used Dell OptiPlex with 16 GB RAM costs under $150 on eBay and runs the moderate tier comfortably.
- Use AWS or Azure free-tier VMs for short-term expansion. Spin up a cloud endpoint, enroll it as a Wazuh agent, and practice monitoring cloud workloads. Shut it down when the session ends to avoid charges.
- Start with VirtualBox on your existing machine for the minimal tier, then migrate to Proxmox on dedicated hardware when you outgrow it.
How do you document your lab build as a portfolio recruiters actually read?
A lab that is not documented is invisible to hiring managers. The record of your configuration choices, troubleshooting decisions, and detection logic is the portfolio artifact that proves you can do the work, not just describe it.
Recommended repo structure:
soc-home-lab/
├── README.md              # Architecture overview, quick-start, and prerequisites
├── architecture/
│   └── network-diagram.png
├── deployment/
│   ├── wazuh-setup.md
│   ├── suricata-config.md
│   └── pfsense-rules.md
├── detections/
│   ├── ssh-brute-force.xml
│   └── port-scan.xml
├── investigations/
│   └── 2026-01-15-ssh-brute-force-writeup.md
└── dashboards/
    └── kibana-export.ndjson
What hiring managers look for:
- A reproducible setup: can someone clone your repo and follow the steps to get a working lab? If yes, that demonstrates documentation discipline.
- Detections you authored, not just installed. Include the rule XML or EQL query, the test case that triggered it, and a screenshot of the alert.
- Investigation write-ups that show your analytical reasoning, not just the conclusion.
- MITRE ATT&CK coverage: a simple table showing which technique IDs your detections cover signals structured thinking.
Pro Tip: Tag your repo at key milestones: v0.1-siem-online, v0.2-first-detection, v0.3-full-pipeline. Recruiters who click through to your GitHub can see the progression of your work, which is more convincing than a single polished README.
Export Kibana dashboards as PDFs or screenshots before sharing. Never publish raw log data from your lab publicly, even if it looks synthetic. Scrub hostnames and IP addresses from any public-facing documentation.
How structured training maps to lab exercises and career outcomes
A SOC home lab teaches you how to use tools. Structured training teaches you why specific controls exist and how to make defensible decisions under pressure. The two work best together.
| Course Module | Matching Lab Exercise | Measurable Outcome |
|---|---|---|
| Detection engineering fundamentals | Author SSH brute-force rule in Wazuh | Rule fires correctly on simulated attack; false positive rate documented |
| MITRE ATT&CK mapping | Tag all lab detections with technique IDs | ATT&CK coverage matrix showing detected vs. undetected techniques |
| Incident triage and response | Complete full exercise from alert to closed ticket | Investigation write-up filed; time-to-close under 90 minutes |
| Threat intelligence integration | Connect MISP feed to Wazuh; enrich alerts with IOCs | IOC match detected during C2 beaconing exercise |
| Log normalization and pipeline | Configure Filebeat + Logstash + Elasticsearch | All log sources visible in single Kibana index pattern |
Blueteam-academy’s training modules include templates, playbooks, and generative-AI-enhanced learning artifacts that reduce the setup friction that typically consumes a beginner’s first week. Instead of spending hours deciphering Wazuh’s documentation to write your first rule, you work from a structured template that shows the correct field mappings and explains the reasoning behind them.
The career linkage is direct. A GitHub repo with documented detections, investigation write-ups, and a clear architecture diagram, combined with a completed course certificate, gives a hiring manager two independent signals: you understand the theory and you have done the work. For IT professionals transitioning into cybersecurity, that combination consistently outperforms a certification alone in technical screening conversations.
The Threat and Control Method taught in Blueteam-academy’s curriculum maps directly to detection design: you identify a threat, select a control, and verify the control works. Every lab exercise in this guide follows that same logic, so the course and the lab reinforce each other rather than covering the same ground twice.
Key Takeaways
A working SOC home lab requires five integrated components: a SIEM, endpoint agents, a network sensor, an isolated attacker host, and a case management system. Deploy them together from day one and every exercise teaches the full SOC workflow.
| Point | Details |
|---|---|
| Start with the minimal stack | Wazuh, Suricata, Kali, pfSense, and osTicket cover every core SOC role on 8 GB RAM. |
| Isolate the attacker subnet | pfSense must block outbound internet from the attacker VLAN by default to prevent accidental exposure. |
| Automate alert-to-ticket early | Configure a Wazuh webhook to osTicket or TheHive from the start; this is the skill most beginners skip and most employers test. |
| Document every detection | A GitHub repo with authored rules, investigation write-ups, and MITRE coverage is a stronger hiring signal than a certification alone. |
| Blueteam-academy accelerates the gap | Structured modules with templates and playbooks cut the setup friction that consumes a beginner’s first week and map directly to lab exercises. |
Balancing realism and safety when running offensive tooling at home
The most common mistake beginners make is treating the attacker subnet as an afterthought. Kali Linux is a professional tool, and the same capabilities that make it useful for learning make it dangerous if it reaches the wrong network.
Running a SOC home lab with offensive tooling at home is genuinely manageable, but it requires deliberate constraints. The pfSense firewall is not optional; it is the boundary between your learning environment and your home network, your neighbors’ networks, and the public internet. A misconfigured NAT rule or a forgotten bridge interface can expose your Kali VM to the internet or route attack traffic through your ISP’s connection, which creates real legal exposure.
Safety checklist:
- Confirm the attacker VLAN has no default route to the internet before every session.
- Use a dedicated physical NIC for lab traffic if possible, completely separate from your home Wi-Fi or LAN.
- Never run Metasploit, Hydra, or any scanning tool against IP addresses outside your defined lab subnets.
- Disable the attacker VM’s network interface when not actively running an exercise.
- Review pfSense firewall logs weekly to catch unexpected traffic patterns.
On the legal and ethical side: run attacks only against VMs you own and control, or against intentionally vulnerable targets like DVWA and Cowrie. Scanning or exploiting any system you do not own, even accidentally, can violate the Computer Fraud and Abuse Act. The lab subnets defined in this guide exist precisely to keep all traffic contained. Treat that boundary as non-negotiable.
This article is general educational guidance, not legal advice. Confirm your specific setup’s compliance with applicable laws and consult a qualified professional if you have questions about your jurisdiction’s rules.
Blueteam-academy cuts your learning curve without replacing the lab
Building a SOC home lab from scratch teaches you something no course can fully replicate: the experience of wiring tools together, debugging log pipelines at 11 PM, and finally seeing an alert fire correctly. That hands-on friction is valuable. What structured training adds is the framework that makes the friction productive rather than just exhausting.
Blueteam-academy’s cybersecurity courses give lab builders detection templates, triage playbooks, and peer-reviewed modules that map directly to the exercises in this guide. Instead of spending your first week figuring out Wazuh’s rule syntax from scratch, you work from a structured template that explains the field mappings and the reasoning behind them. The generative-AI enhancements surface relevant examples faster, and the student community means you are not debugging alone at midnight.
Learners who combine the lab with structured training consistently reach three milestones faster: a working SIEM with enrolled agents, at least one authored detection verified against a simulated attack, and a documented investigation write-up ready to show a hiring manager. If you are ready to move from IT into a security operations role, start with Blueteam-academy’s course catalog and run the lab exercises alongside each module.
Useful sources and repos to deploy the recommended stack
The repos and docs below are the fastest paths to a working lab. Each one is linked directly to the project or documentation page.
- Wazuh documentation: Start here for agent installation, rule authoring, and integration guides. The “Getting Started” section covers the full deployment sequence.
- jamesagarside/elastic-at-home: A reproducible Elastic stack deployment for home labs. Good starting point for integrating Wazuh with Elasticsearch and Kibana.
- lidless-labs/soc-stack: One-command Proxmox deployment of Wazuh, TheHive, MISP, Zeek, and Suricata in LXC containers. The fastest path to a full stack. The README explicitly notes this is a lab environment, not production-hardened.
- rsn9454/soc-home-lab: A 16-step documented home SOC project with ELK, attacker VMs, detection rules for SSH/RDP brute force, and a Kibana-to-osTicket webhook integration. Clone this to see what a complete project looks like.
- jijuta/SoC-Home-Lab: A well-structured repo demonstrating how to document a lab build as a portfolio artifact, with README conventions and investigation write-up examples.
- bsamita/Home-SOC-Lab: Focuses on Wazuh Manager with Ubuntu hosting and Windows agent enrollment. Useful reference for the beginner Wazuh setup path.
- Realynx/PolySIEM: Inventory and integration health dashboards for keeping a lab auditable and reproducible.
- Sysmon downloads (Microsoft Sysinternals): Official download and configuration reference for Windows endpoint telemetry.
- Kali Linux downloads: Official ISO downloads for the attacker VM. Use the “Installer” image for a full Kali install on a dedicated VM.
- VirtualBox downloads: Free hypervisor for running the minimal stack on a single machine.
- SIEM Home Lab Setup: Step-by-Step Guide (Entry to Cyber): A practical walkthrough covering Kibana/Elasticsearch installation, agent enrollment, detection rule creation, and dashboard building. Read this alongside the Wazuh docs for a complete picture.
First repo to clone for a minimal deploy: rsn9454/soc-home-lab gives you a documented, step-by-step reference with working detection rules and an alert-to-ticket integration. First doc to read: the Wazuh “Getting Started” guide, then return to the soc-stack README if you are on Proxmox.
