

The median SOC analyst salary in the U.S. varies depending on the source and how the title is defined, but the range runs from entry-level Tier 1 triage salaries up to well above six figures for senior analysts and SOC leads. Three variables explain most of that spread: tier and experience, geographic market, and specialized skills or security clearance.
Here is what the data shows at a glance:
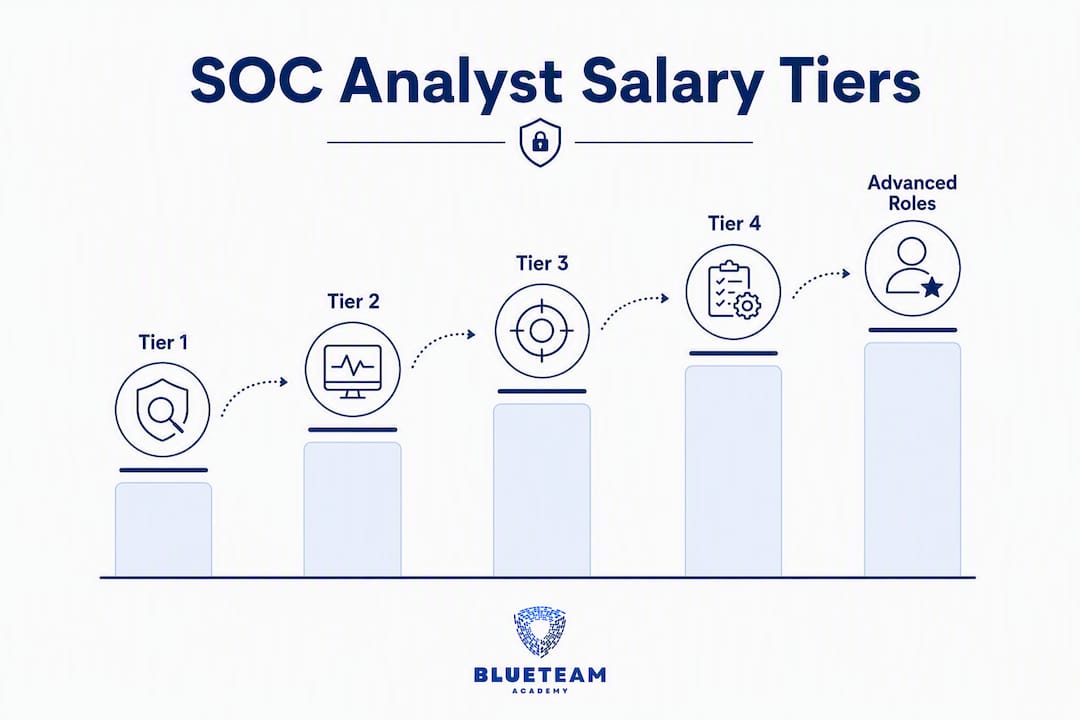
- Tier: Tiered pay bands span $58k–$68k (Tier 1), $70k–$85k (Tier 2), $85k–$92k+ (Tier 3/senior), and above $100k for SOC leads.
- Location: Certain regions such as DC/Northern Virginia, the Bay Area, and NYC consistently pay above the national median.
- Skills and clearance: Having a security clearance and specialized skills such as cloud investigation or automation can significantly increase base pay.
Data for this article draws from employer-disclosed listings (Datamata, 126 active listings), BLS OES May 2024 benchmarks via DecipherU, Salary.com posting scans, InfoSec Job Board tier benchmarks, and self-reported aggregators including Indeed and ZipRecruiter. Because each source measures something slightly different, the sections below note which figure comes from which methodology.
Table of Contents
- How does SOC analyst pay break down by tier?
- What factors actually move your SOC analyst pay?
- Which U.S. cities and industries pay SOC analysts the most?
- What does total compensation look like beyond base salary?
- How can you increase your SOC analyst pay?
- Where do these salary numbers come from?
- How does targeted training accelerate your path to higher pay?
- What is the national average SOC analyst salary in 2026?
- Key Takeaways
- The part of SOC pay nobody talks about honestly
- Blueteam-academy shortens the path from Tier 1 to Tier 2 pay
- Useful sources and data references
How does SOC analyst pay break down by tier?
“SOC analyst” is not one job. It is at least four, and treating the title as a single benchmark is the most common mistake people make when researching this career. InfoSec Job Board identifies it as the most common entry point into cybersecurity, which partly explains why the aggregated average looks modest: it blends entry-level triage work with senior threat-hunting roles.

| Tier | Typical Experience | Base Range (Low–High) |
|---|---|---|
| Tier 1 (triage/alert review) | 0–2 years | $58,000–$68,000 |
| Tier 2 (investigation/escalation) | 2–4 years | $70,000–$85,000 |
| Tier 3 (threat hunting/senior) | 4–7 years | $85,000–$92,000+ |
| SOC Lead / Manager | — | Above $100,000 |
Tier 1–3 base ranges from InfoSec Job Board and DecipherU BLS-derived bands; SOC Lead/Manager figures reflect Datamata’s 75th percentile ($132,231) and DecipherU lead estimate ($147k).
Career timeline and typical moves between tiers:
- Tier 1 to Tier 2 (12–24 months): The jump happens when you move from closing alerts to investigating them. Analysts who build SIEM query skills, start writing basic detection rules, and earn CompTIA CySA+ tend to make this move faster. The pay lift is typically $10,000–$20,000.
- Tier 2 to Tier 3 (2–3 more years): This is where specialization matters. Threat hunting, detection engineering, cloud investigations, and incident response leadership are the skills that push you into the $85k–$119k band.
- Tier 3 to SOC Lead: Usually requires demonstrated project ownership, mentoring junior analysts, and often a GIAC certification or equivalent. The move to lead/manager can push total compensation above $100,000, with top earners (Datamata 75th percentile and DecipherU estimates) reaching $132,000–$147,000.
One practical note: when you see a job posting titled simply “SOC Analyst,” it is almost always Tier 1 or early Tier 2. If the description mentions “threat hunting,” “detection engineering,” or “incident response lead,” you are looking at a Tier 3 or lead role with a correspondingly different pay band.
What factors actually move your SOC analyst pay?
Location and tier are the two biggest levers, but several other factors produce measurable pay differences worth understanding before you negotiate.
Major pay drivers:
- Security clearance: Cleared roles in federal contracting and defense carry a clearance premium of roughly $10,000–$25,000 on base pay. A TS/SCI clearance at a defense contractor in Northern Virginia can push a Tier 2 analyst well above the national median for that tier.
- Geographic market: DC/Northern Virginia, the Bay Area, NYC, and Seattle pay 15–30% above the national median. More on specific city figures in the next section.
- Industry: Defense contracting and financial services consistently pay more than healthcare or retail for the same tier. Large cloud-native tech companies often add equity on top.
- Specialized skills: Python scripting, cloud investigation (AWS/Azure/GCP), SIEM tuning, and detection engineering are the skills employers pay a premium for. Analysts who can automate triage workflows are increasingly rare and compensated accordingly.
- Shift differentials: Night-shift and weekend rotations typically carry a 10–15% differential. That is real money, though it comes with trade-offs discussed in the perspective section.
- Remote vs. on-site: Fully remote roles vary widely. Some employers pay to the candidate’s local market; others pay to the company’s headquarters market. Always clarify which model applies before comparing offers.
Why figures differ across sources: Employer-disclosed listings (like those Datamata analyzes) show what companies actually post as base pay. Self-reported aggregators like Indeed and ZipRecruiter include bonuses, shift pay, and overtime in some responses, and their samples skew toward people who chose to report. Neither is wrong; they measure different things. When benchmarking a specific offer, employer-disclosed data is the cleaner comparison for base salary.
Pro Tip: The single highest-leverage skill path right now is moving from alert triage into detection engineering or cloud investigation. These skills are scarce, they map directly to Tier 2 and Tier 3 responsibilities, and employers treat them as a separate hiring category, not just a promotion.
Which U.S. cities and industries pay SOC analysts the most?
Geography explains a large share of the pay variance in this field. Defense-concentrated regions and major tech hubs consistently outlay the national median, sometimes by a significant margin.
Top-paying metro areas (estimated premium vs. national median):
- Washington, DC / Northern Virginia: The highest-density market for cleared SOC roles in the country. Federal contracting and defense firms drive demand, and the clearance premium stacks on top of the geographic premium. Analysts here routinely earn 20–30% above the national median for their tier.
- San Francisco Bay Area: Cloud-native tech companies and large enterprise security teams pay top-of-market. Cost of living is high, but so are base salaries and equity packages. Expect 20–25% above national median.
- New York City / Long Island: Financial services and large enterprise security operations push pay above the national median by roughly 15–20%. Compliance-heavy industries (banking, insurance) value SOC experience heavily.
- Seattle: Major cloud providers and tech companies anchor this market. Analysts with cloud investigation skills are particularly well-compensated here.
- Austin / Denver: Emerging tech markets with growing SOC demand. Premiums are more modest (5–10% above median) but cost of living is lower than the top-tier cities.
Salary.com’s Security Operations Analyst data shows a U.S. average around $132,160 for that title variant, which reflects the higher end of the market, particularly in these premium metros.
Top-paying industries:
- Defense contracting and federal government: Clearance requirements create a smaller talent pool, which drives pay up. This is the most reliable path to a $100k+ Tier 2 role.
- Financial services (banking, fintech, insurance): Compliance requirements and high-value assets mean security operations teams are well-funded. Tier 2 analysts in NYC finance often earn more than Tier 3 analysts in lower-paying markets.
- Large cloud-native tech: RSUs and bonuses can make total comp significantly higher than base salary suggests.
- Healthcare: Growing demand, but pay typically lags defense and finance for equivalent tiers.
A note on remote roles: If a company posts a remote SOC analyst role and pays to the company’s headquarters market (say, San Francisco), you can earn a Bay Area salary from a lower cost-of-living city. That arbitrage is real, but it is becoming less common as more employers shift to location-based pay models. Always ask directly which pay model applies.
What does total compensation look like beyond base salary?
Base salary is the starting point, not the full picture. For SOC analysts, total compensation can differ meaningfully from base depending on employer type and tier.
Common total comp components:
- Annual bonus: Typically 5–15% of base at most employers. Defense contractors and financial services firms tend toward the higher end. Some SOC roles at large tech companies carry performance bonuses of 15–20%.
- RSUs (restricted stock units): Common at publicly traded tech companies. A Tier 2 or Tier 3 analyst at a large cloud provider might receive $20,000–$60,000 in annual RSU grants on top of base salary, vesting over four years.
- Overtime and shift differentials: Night-shift and on-call rotations add 10–15% to effective annual pay. For Tier 1 analysts, this can be the difference between $63,000 and $72,000 in actual take-home.
- Sign-on bonuses: More common for cleared roles and senior positions. A cleared Tier 2 hire in Northern Virginia might see a $5,000–$15,000 sign-on to offset the clearance processing wait.
- Benefits: Health insurance, 401(k) matching, and tuition reimbursement vary widely. Federal contractors often offer strong benefits packages that partially offset lower base salaries compared to tech.
Aggregator data and employer-disclosed listings treat these components differently. Glassdoor’s data for Security Operations Center Analysts, based on 140 salaries submitted as of June 2026, shows a median total pay of $128,000 with additional pay (bonuses, profit sharing) accounting for $22,000–$41,000 of that figure. Base pay in that same sample runs $75,000–$129,000.
Pro Tip: When negotiating, ask for the total comp breakdown in writing before comparing offers. A $90,000 base with a 15% bonus target and strong RSU grants can easily outperform a $100,000 base with no variable pay. The number that matters is what lands in your account over three years.
How can you increase your SOC analyst pay?
The fastest path to higher pay is tier progression, and tier progression comes from building the skills that Tier 2 and Tier 3 roles actually require. Here is a practical roadmap.
Step 1: Tier 1 foundations (months 0–12)
- Build SIEM fluency. Splunk, Microsoft Sentinel, and IBM QRadar are the most common platforms. Reps matter more than certifications at this stage.
- Earn CompTIA Security+. It is the baseline credential most employers expect and it signals you are serious about the field.
- Document your alert investigations. Keep a log of the most interesting cases you worked. This becomes your promotion evidence.
Step 2: Moving to Tier 2 (months 12–24)
- Learn to write detection rules and SIEM queries from scratch, not just run existing ones.
- Earn CompTIA CySA+. It maps directly to the investigation and analysis skills Tier 2 requires.
- Start learning Python basics. Even simple automation scripts that reduce manual triage time are visible to managers and hiring teams.
- Take on one project that has a measurable outcome: a detection rule that catches something new, a playbook you wrote, a false-positive rate you reduced.
Step 3: High-pay pivots at Tier 3 (years 3–5)
- Specialize in one of the high-premium areas: cloud investigation (AWS/Azure/GCP), detection engineering, or threat hunting using MITRE ATT&CK.
- Pursue a GIAC certification (GCIA, GCIH, or GCFE) or, for offensive-informed defense, OSCP. These credentials are expensive but produce measurable pay lifts at the senior level.
- Build a portfolio of detection content: custom Sigma rules, threat-hunting hypotheses you ran, or automation scripts you deployed.
Certification mapping by tier:
- Entry (Tier 1): Security+, Google Cybersecurity Certificate
- Mid (Tier 2): CySA+, Blue Team Labs certifications, Splunk Core Certified User
- Senior (Tier 3+): GIAC GCIA/GCIH, GCFE, cloud security certifications (AWS Security Specialty, Microsoft SC-200)
Negotiation checklist: Before asking for a raise or counter-offering, prepare three things: a list of detections you wrote or improved, a metric showing your alert closure rate or investigation quality, and a market comp figure from employer-disclosed data (not just aggregator averages). Managers respond to evidence, not tenure.
Pro Tip: The help desk to SOC analyst transition is faster than most people think, but only if you close the right skill gap. The gap is almost never technical knowledge in isolation. It is the ability to investigate an alert end-to-end and explain what you found.
Where do these salary numbers come from?
Salary figures for SOC analysts vary across sources because each source measures something different. Understanding the methodology helps you use the data correctly.
| Source | Type | Sample / Scope | Key Figures |
|---|---|---|---|
| Datamata | Employer-disclosed listings | 126 active listings | Median $86,556; 25th $58,600; 75th $132,231 |
| DecipherU (BLS OES May 2024) | BLS-derived benchmarks | National OES survey | Median ~$87,400; entry ~$61k; senior ~$119k |
| Salary.com (SOC-specific) | Job posting scan | U.S. postings | Average $97,320; 25th–75th: $89,017–$105,886 |
| Salary.com (Security Ops Analyst) | Job posting scan | U.S. postings | Average $132,160 |
| Glassdoor | Self-reported | 140 salaries, June 2026 | Median total pay $128k; base $75k–$129k |
| Indeed | Self-reported / mixed | 408 salaries, 36 months | Aggregator figure (base + variable mixed) |
| ZipRecruiter | Aggregator | Rolling average | Aggregator figure (methodology varies) |
Why the numbers differ:
- Employer-disclosed listings (Datamata) show what companies actually post as base pay. This is the cleanest signal for base salary benchmarking.
- Self-reported aggregators (Indeed, ZipRecruiter, Glassdoor) include bonuses, overtime, and shift pay in some responses. Sample sizes and self-selection bias affect the median.
- BLS OES data (via DecipherU) is the most methodologically rigorous but lags the market by 12–18 months and uses a broad title definition.
- Job posting scans (Salary.com) reflect what employers advertise, which can include total comp or base-only depending on how the employer structured the listing.
On percentiles: The 25th percentile tells you what the bottom quarter of the market earns. The 75th tells you what the top quarter earns. The median (50th) is the most useful single number for benchmarking your own offer. Mean/average figures are pulled upward by high earners and are less useful for most people.
Last checked: All figures in this article were verified against source data in 2026. Salary data moves; check the source links directly for the most current snapshots.
How does targeted training accelerate your path to higher pay?
The tier progression roadmap above is clear on paper. In practice, most Tier 1 analysts stall because they never get assigned the investigation work that builds Tier 2 skills. Structured training closes that gap by giving you deliberate practice on the skills employers pay more for.
A focused SOC training program should build the following outcomes, each of which maps directly to a higher-paid tier:
- Alert investigation end-to-end: Moving from “alert closed” to “here is what happened and why” is the core Tier 2 skill. Employers pay for analysts who can do this without hand-holding.
- Log pivoting and correlation: Knowing how to move across log sources (endpoint, network, cloud) to reconstruct an attack chain is what separates investigation from triage.
- Detection tuning: Writing and refining detection rules reduces false positives and demonstrates engineering-level thinking. This is a Tier 3 skill that Tier 2 analysts who learn it early get promoted faster.
- Cloud investigations: AWS CloudTrail, Azure Activity Logs, and GCP audit logs are now standard investigation surfaces. Analysts who can work these environments are in shorter supply.
- Basic Python and automation: Even a script that automates IOC lookups or formats alert data saves hours per week. Managers notice, and it shows up in performance reviews.
The cybersecurity career path from IT roles into SOC work is well-documented, and the analysts who move fastest share one trait: they did not wait for their employer to assign them investigation work. They sought out structured practice, built a portfolio of evidence, and presented it at review time.
Pro Tip: Capstone projects matter more than certificates at the Tier 2 level. A detection rule you wrote that catches a real attack technique, documented with context and outcome, is more persuasive to a hiring manager than another cert on a resume.
What is the national average SOC analyst salary in 2026?
The national average for a SOC analyst in the U.S. in 2026 sits in the $87,000–$97,000 range depending on the source and title definition used. Datamata’s employer-disclosed analysis puts the median at $86,556, while DecipherU’s BLS-derived benchmark lands at approximately $87,400. Salary.com’s SOC-specific posting scan shows an average of $97,320.
The spread between those figures is not a data error. It reflects the difference between employer-disclosed base pay (Datamata), BLS survey methodology (DecipherU), and job posting scans that may blend base and variable pay (Salary.com). For most people benchmarking a job offer, the $86,556–$87,400 range from employer-disclosed and BLS data is the most reliable baseline for base salary.
The BLS projects strong demand for information security analysts through the decade, with employment growth well above the average for all occupations. That demand pressure is one reason pay at the senior tiers has moved faster than inflation over the past several years.
Key Takeaways
SOC analyst pay in the U.S. ranges from about $58,000–$68,000 at Tier 1, $70,000–$85,000 at Tier 2, $85,000–$92,000+ at Tier 3, and above $100,000 for senior analysts and leads, with tier progression and geographic market explaining most of the variance.
| Point | Details |
|---|---|
| National median baseline | Employer-disclosed data puts the U.S. median at $86,556–$87,400; Salary.com’s posting scan shows $97,320. |
| Tier drives the biggest pay jump | Moving from Tier 1 ($58k–$68k) to Tier 2 ($70k–$85k) is the fastest single pay increase available. |
| Location and clearance add real money | DC/Northern Virginia and Bay Area roles pay 15–30% above the national median; a security clearance adds $10k–$25k. |
| Fastest path to higher pay | Build investigation skills, earn CySA+, add Python basics, and target cleared or cloud-focused roles. |
| Blueteam-academy training | The From IT to Cybersecurity course maps directly to Tier 1→Tier 2 skill progression with capstone projects you can show hiring managers. |
The part of SOC pay nobody talks about honestly
Most salary guides treat tier progression as a clean ladder. In practice, it is more like an apprenticeship where the quality of your environment matters as much as your effort. A Tier 1 analyst at a well-run SOC with senior mentors and real investigation exposure can reach Tier 2 pay in 12 months. The same analyst at a SOC where Tier 1 is a permanent alert-closing queue with no escalation path might wait three years and still not have the skills to interview for Tier 2.
The night-shift premium is real, and for analysts early in their careers, it is tempting. An extra 10–15% on a $63,000 base is meaningful money. But night shifts at most SOCs mean fewer senior analysts on the floor, fewer escalations to learn from, and less visibility to the people who make promotion decisions. The premium can cost you more in career development than it pays in the short term. If you are choosing between a day-shift Tier 1 role at a well-staffed SOC and a night-shift role with a differential, the day-shift role is usually the better investment in years one and two.
The other thing worth saying plainly: the analysts who move fastest are not the ones who studied the most certifications. They are the ones who built a habit of documenting their investigations, writing up what they found, and presenting that evidence when it mattered. That habit is a skill, and it is learnable.
Blueteam-academy shortens the path from Tier 1 to Tier 2 pay
If you are an IT professional looking to move into a SOC role, or a Tier 1 analyst trying to close the gap to Tier 2, the skills that produce the pay lift are specific: alert investigation, log pivoting, detection tuning, cloud investigation, and basic automation. Blueteam-academy’s From IT to Cybersecurity course is built around exactly those outcomes, using the Threat & Control Method to give you a practical decision-making framework rather than a list of concepts to memorize.
The course includes recorded classes, templates, peer-reviewed content, generative AI-enhanced practice, and 12 months of access, so you can build at your own pace while working your current role. Capstone projects give you concrete evidence to bring to a promotion conversation or a new employer. Visit Blueteam-academy to see the full curriculum and enrollment details.
Useful sources and data references
All figures in this article were last checked against source data in 2026. Where sources differ, the methodology note explains why.
- Datamata Studios — SOC Analyst Salary 2026: Employer-disclosed listings analysis; 126 active listings; median $86,556; 25th percentile $58,600; 75th percentile $132,231. Best source for base salary benchmarking because it reflects what employers actually post.
- DecipherU — SOC Analyst Compensation Bands 2026: BLS OES May 2024 benchmarks with derived tier multipliers; national median ~$87,400; entry ~$61k; senior ~$119k; lead ~$147k. Methodologically rigorous but lags the live market by 12–18 months.
- InfoSec Job Board — SOC Analyst Salary 2026: Tiered benchmark ranges and career progression guidance; Tier 1 ~$58k–$68k; Tier 2 ~$70k–$85k; Tier 3 ~$85k–$92k+; SOC lead above $100k. Useful for tier-specific benchmarking.
- Salary.com — Security Operation Center Analyst: Job posting scan; average $97,320; 25th–75th percentile $89,017–$105,886 (June 2026 snapshot). Reflects posted pay, which may blend base and variable.
- Salary.com — Security Operations Analyst: Separate title variant; average $132,160 (July 2026). Higher figure reflects a broader or more senior title definition.
- Glassdoor — Security Operations Center Analyst: 140 self-reported salaries as of June 2026; median total pay $128k; base pay $75k–$129k; additional pay $22k–$41k. Best source for total comp context.
- BLS — Information Security Analysts: Primary government source for employment outlook and broad occupational wage data. Use for long-term demand context.
- Indeed: Self-reported and mixed-methodology aggregator; 408 salaries over 36 months. Useful for directional benchmarking; treat figures as total comp estimates, not base-only.
- ZipRecruiter: Rolling aggregator average; methodology varies by title and time period. Use alongside employer-disclosed data, not as a standalone benchmark.
- Dropzone.ai: Career-path and tier-mapping resource; useful for progression narratives and specialization guidance. No direct salary figures cited.
Employer-disclosed vs. self-reported: When comparing a specific job offer to market data, use employer-disclosed sources (Datamata, Salary.com posting scans) for base salary and self-reported sources (Glassdoor, Indeed) for total comp context. Mixing the two without noting the difference is the most common benchmarking error.

2 responses to “SOC Analyst Salary in 2026: Tiers, Cities, and Pay Drivers”
[…] a deeper look at SOC analyst pay tiers and what drives them, the role-specific breakdown is worth reviewing before you accept or counter an […]
[…] And once you’re ready to see what the market pays for this skill set, our breakdowns of SOC analyst salary in 2026 and entry-level cybersecurity jobs are worth reading before you apply anywhere. You […]